In order to understand the unique place silver occupies in today ís market, we must look at the silver market trends that began in the 1950s.
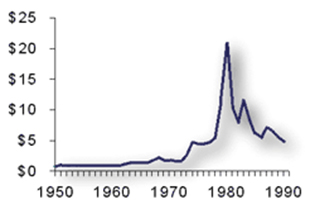
- 1950-1960
(yearly average prices based on London PM Fix)
From the end of World War II through the early 1960s, fabrication demand for silver rose sharply. The rebuilding of Europe and Japan and a worldwide movement toward electrification, housing construction and durable consumer items was responsible for this uptick. Many electrical appliances, as …
- 1960-1965
(yearly average prices based on London PM Fix)
During the 1960s the Treasury moved from being a net buyer of silver to being a net seller of silver. In 1960, the Treasury sold 22 million ounces of silver in bullion form, and used another 46 million ounces in coinage. The next year the Treasury …
- 1966-1970
(yearly average prices based on London PM Fix)
By 1966 the Treasury’s program of eliminating silver from coinage was in place. The Treasury continued to use some silver in coins from then until 1969, but the annual average during these four years was 38.5 million ounces, down from 178 million ounces per year on …
- 1971-1978
(yearly average prices based on London PM Fix)
The weighted average price paid in these investor acquisitions, using annual average prices, was $1.88 per ounce. This figure will be important in understanding the next phase of the silver market, from 1971 into 1979, when the new supply of silver fell short of industrial requirements …
- 1979-1980
(yearly average prices based on London PM Fix)
By 1979, investors and other market participants had come to the strong conviction that the silver market was facing a severe shortage of metal, and that prices were likely to rise sharply at some point. The market had been living off of investor selling for seven …
- 1981-1990
(yearly average prices based on London PM Fix)
By the beginning of 1981 the silver market was starting to adjust after the traumatic events of 1980. Industrial silver demand was declining, both because of the worldwide recession that had set in, and in reaction to high silver prices. Investment demand for silver also fell …
- 1990-1999
(yearly average prices based on London PM Fix)
Throughout the 1990′s, the main question for the silver market was the rate at which above-ground stocks of bullion and coins were being consumed by the widening gap between fabrication demand and conventional supply, and when this erosion of stocks might begin to significantly impact the …
- 2000-2010
(yearly average prices based on London PM Fix)
Silver prices remained under pressure for most of 2000, averaging $4.95 per troy ounce. The trading range did manage to increase marginally year-on-year, recording a high of $5.45 in February of 2000 and a low of $4.57 in December. The silver price softened throughout the year, …
- 2011-Present
Strong silver investment in 2011 paved the way to a record annual average silver price in a year marked by steep price volatility while retail silver investment demand for both physical bullion bars and coins & medals surged to record levels.
Silver posted an annual average price of $35.12 in 2011, more than double the …