Silver Demand
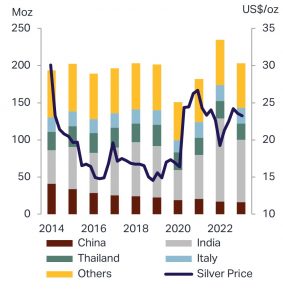
Silver jewelry fabrication fell by 13 percent in 2023 to 203.1 Moz. The losses were concentrated in India, where demand eased after reaching its highest total in 2022. Excluding India, total global losses were modest at 3 percent. This was mainly due to the weakness of US and European jewelry consumption (due to such drivers as cost-of-living issues) plus destocking by retailers.
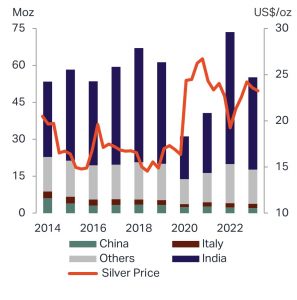
Silverware demand in 2023 fell by 25 percent to 55.2 Moz. This mainly reflected an elevated base in 2022 when fabrication achieved a record high. As with jewelry, overall losses were almost entirely due to India, owing to high local silver prices.
Silver Jewelry and Silverware Demand
Silver jewelry fabrication soared 29 percent to a record level last year at 234.1 Moz. This was led by India, where pent-up demand, combined with heavy re-stocking by retailers and a move to higher purities, saw volumes double compared to 2021. Notable gains were also seen in Europe, where higher consumption helped even as exports from Italy fell. Exceeding jewelry in percentage terms, silverware demand in 2022 saw astounding growth of 80 percent to 73.5 Moz, a record high. As with jewelry, gains in silverware were almost entirely due to India, where demand more than doubled last year on the back of employment and incomes returning to pre-pandemic levels.
Global Silver Jewelry Fabrication

Global Silverware Fabrication

Material and statistics in this section were adapted in part from the Silver Institute’s World Silver Survey 2024.

Recent Comments